Made withHyperblog
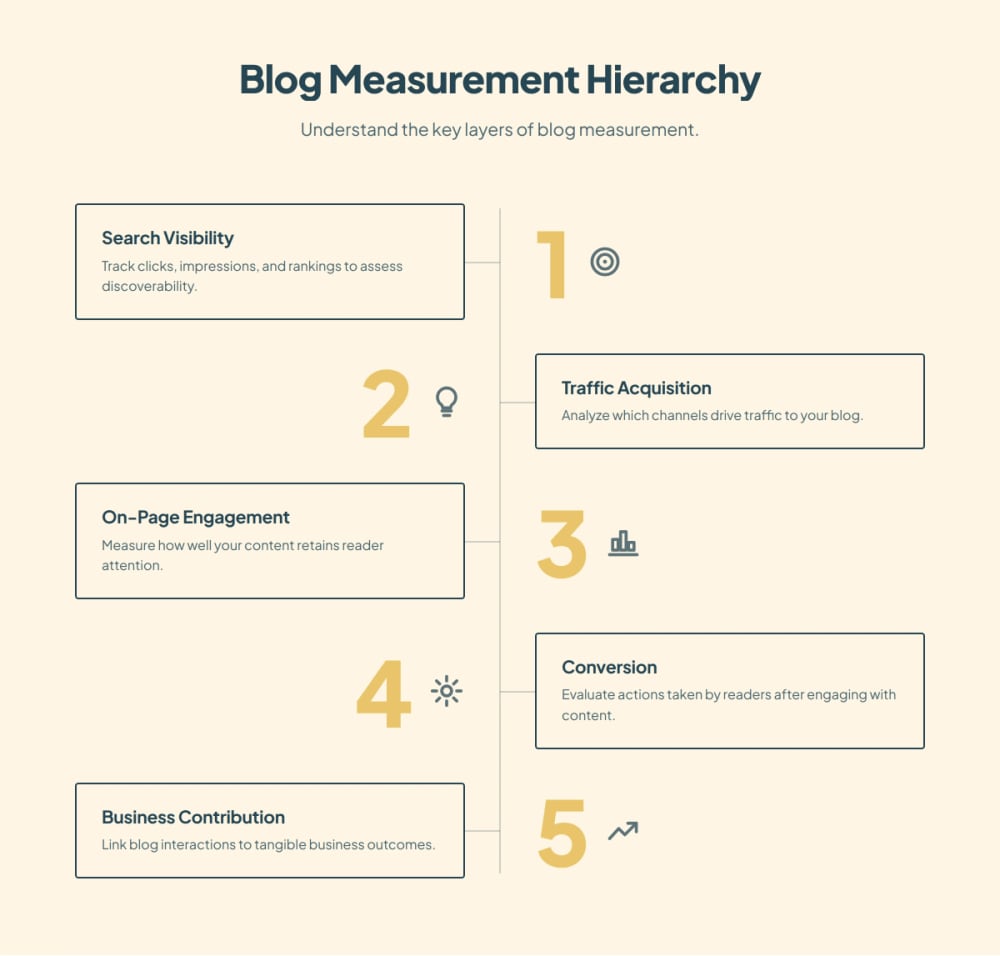
Blog analytics is the practice of connecting what happens before a reader arrives, what they do on the page, and whether the visit leads to a meaningful business action. A useful measurement system follows five layers: search visibility, traffic acquisition, on-page engagement, conversion, and business contribution.
That hierarchy matters because no single metric explains whether a blog is working. Impressions can rise while clicks remain flat. Traffic can grow while the wrong audience arrives. Readers can engage deeply and still have no relevant next step. A measurement plan should show where performance is improving, where the journey breaks, and which action the team should take next.
Begin with the reader journey instead of a dashboard. Each layer answers a different question and has a different source of truth.
Search visibility shows whether pages are being discovered for relevant queries. Track clicks, impressions, click-through rate, average position, ranking queries, and the pages Google chooses for those queries. Review query and page data together so you can distinguish a weak snippet from an ownership problem.
Google Search Console reports total clicks, impressions, average CTR, and average position. Its tables can group the data by query or page, while weekly and monthly views help smooth short-term fluctuations. Average position is an aggregate, so use it as a directional signal rather than a fixed daily rank.
Acquisition metrics show which channels and campaigns bring visits to the blog. In GA4, review sessions by source and medium, organic search traffic, referral traffic, returning users, and landing pages. Keep channel definitions consistent so an analytics configuration change does not look like a traffic change.
Search Console and GA4 measure different parts of the journey. Search Console is the source of truth for activity in Google Search before the visit. Google Analytics is the source of truth for behavior after the person arrives. Differences between clicks and sessions are expected because the tools use different measurement systems.

Download our comprehensive checklist to optimize your blog analytics strategy.
Engagement metrics indicate whether the landing page holds attention and helps the reader move forward. Useful measures include engaged sessions, engagement rate, average engagement time, scroll milestones, useful outbound clicks, and clicks to related articles.
GA4 defines an engaged session as one that lasts longer than 10 seconds, includes a key event, or includes at least two page or screen views. That definition is useful, but it does not prove that the article answered the reader's question. Pair the metric with the intended job of the page.
Conversion metrics measure the next action the article was designed to support. Depending on intent, that might be a newsletter signup, lead-magnet request, demo request, trial start, product-page visit, or qualified contact form submission.
Mark only meaningful actions as key events. Track CTA impressions and clicks separately from completed submissions so you can locate the failure point. A high CTA click rate with few form completions suggests a form or offer issue. A low CTA click rate points back to message, placement, or intent alignment.
Business contribution connects blog interactions to qualified leads, opportunities, revenue, retention, or another outcome the company values. This layer usually requires CRM or product data in addition to analytics.
Avoid forcing every article into a last-click revenue model. Educational content can influence a later branded search, product visit, sales conversation, or self-reported discovery. Use first-touch, last-touch, assisted, and self-reported evidence together when the buying journey is long. State the attribution limits instead of presenting a precise number as complete truth.
Before publishing, record what the page is supposed to do. A simple measurement contract keeps teams from judging every article by the same metric.
Define the primary search intent, intended reader, focus query, page type, useful next action, leading indicators, lagging indicators, and review date. For an informational guide, the leading indicators might be relevant impressions, query coverage, engagement, and links to a commercial page. A comparison page may be judged more heavily by product-page visits and qualified trial starts.
The contract should also name the page's primary keyword owner. If two articles begin attracting the same high-intent query, inspect both pages before calling it cannibalization. Different page types can appear for similar wording without creating a true conflict.
Share your thoughts on the most difficult metrics to track.
Which blog metric do you struggle with the most?
A practical scorecard should fit on one page and lead to a decision. Use comparable windows, such as the latest completed 28 days versus the previous 28 days, and include a longer baseline when volume is low.
For each URL, record indexability, primary topic, clicks, impressions, CTR, impression-weighted position, organic sessions, engaged sessions, engagement rate, intended CTA clicks, key events, and qualified leads when available. Add the publish date and major update dates so the numbers have context.
Group the same fields by topic cluster as well. A pillar may help several supporting articles gain visibility even when its own conversions are modest. Cluster reporting also reveals missing internal links, uneven coverage, and pages that compete for the same reader job.
For portfolio reporting, separate new posts, established posts, and recently refreshed posts. A two-week-old article and a two-year-old article should not be compared as if they had the same opportunity to accumulate links, queries, and returning visitors.
The page may be appearing for more queries, lower positions, or less relevant searches. Break the change down by query and page. If positions 8 to 30 account for the increase, the opportunity may be deeper coverage and stronger internal links. If position is stable and CTR falls, review the title, description, result type, and query fit.
Search demand, seasonality, result-page features, or the query mix may have changed. Compare impressions, branded versus non-branded queries, country, device, and the same period last year when enough history exists. Avoid rewriting a page solely because a short comparison is down.
The page may be attracting a broader audience than its content serves. Inspect landing-page queries, traffic sources, device mix, and the first screen of the article. Confirm that the title promise matches the answer readers receive.
Check whether the next action matches the reader's stage. A product demo can be premature on an introductory article. A related guide, checklist, newsletter, or focused content upgrade may create a more useful path.
AI-assisted discovery belongs inside the visibility layer, but measurement remains incomplete across platforms. Google announced dedicated generative AI performance reports in Search Console in June 2026 and completed the worldwide rollout by August 31, 2026. The reports show impressions, pages, countries, devices, and dates for eligible generative AI features.
Use those reports as one source, then record identifiable referral traffic and a repeatable set of representative prompts where appropriate. Prompt checks are directional because answers can change by system, wording, account, location, and date. A citation count should not replace qualified visits or business outcomes.
A monthly review is usually frequent enough to detect movement without reacting to daily noise. Use this sequence:
1. Confirm tracking health. Check that analytics tags, key events, forms, consent behavior, and Search Console access still work.
Blog analytics connects search visibility, traffic acquisition, on-page engagement, conversions, and business outcomes so a team can understand how its blog supports reader and company goals.
Start with relevant impressions, clicks, CTR, ranking queries, organic sessions, engaged sessions, key events, CTA activity, and qualified leads. Choose the final set based on each page's intent.
Search Console measures performance in Google Search before a visit, including queries, impressions, clicks, CTR, and position. GA4 measures sessions, engagement, events, and key events after the visitor arrives.
A monthly review is usually suitable for page and cluster decisions. Use weekly checks for tracking failures or major launches, and quarterly reviews for content architecture and strategy.
Track CTA impressions and clicks, form starts, completed forms, lead-magnet requests, trial starts, and qualified CRM records. Use first-touch, assisted, and self-reported evidence when the buying journey spans several visits.
Analytics can support an ROI assessment, but attribution is rarely complete. Combine search, behavioral, conversion, CRM, and self-reported evidence, and state the limits of the chosen attribution model.
2. Compare completed periods. Exclude partial days and note migrations, redesigns, campaigns, outages, and measurement changes.
3. Find opportunities. Prioritize pages with meaningful impressions, low CTR, positions near the first page, declining query coverage, or strong engagement with a weak next step.
4. Check ownership. Normalize HTTP and HTTPS, www and non-www, case, parameters, and trailing slashes before looking for competing URLs.
5. Assign one action. Choose Keep, Update, Retarget, Merge, Redirect, or Create. Record the evidence and the page that should own the intent.
6. Review the result later. Annotate the change date and wait for enough data before deciding whether the action helped.
Measurement starts before publication. Add tracking requirements to the brief, use stable URLs, keep internal links crawlable, and make the intended next action visible. After publication, verify the live page, analytics tag, Search Console discovery, CTA event, and form completion path.
Hyperblog supports custom tracking code that can apply across blog pages, including GA4 and other analytics or marketing tools. Its publishing workflow can also include contextual CTAs, forms, lead magnets, polls, FAQs, and related content. The team still needs to define events, review data quality, and decide what the evidence means.
A useful blog analytics system connects discovery, acquisition, engagement, conversion, and business evidence without collapsing them into one score. It tells the team where the reader journey is working, where it breaks, and which page deserves attention.
Start with a small scorecard and a monthly review. Keep definitions stable, compare complete periods, protect keyword ownership, and record every material change. The goal is a better decision process, not a larger dashboard.
Subscribe to Our Newsletter
Stay up to date with our latest news and updates.