Made withHyperblog

Blog KPIs turn a vague goal such as “grow the blog” into a small set of measurable outcomes. The useful ones connect search visibility, reader behavior, conversion, and business contribution. They also tell a team what to do next when a number changes.
A KPI is a metric tied to a decision and an objective. Every KPI is a metric, but many metrics are only context. Pageviews, keyword counts, and average position can be useful signals. They become misleading when they are treated as proof of growth without query relevance, conversion quality, or business context.
This guide gives you 20 practical blog metrics, their formulas, and the decision each one supports. Use it as the metric layer beneath a broader blog analytics system, then choose only the measures that fit the job of each article.
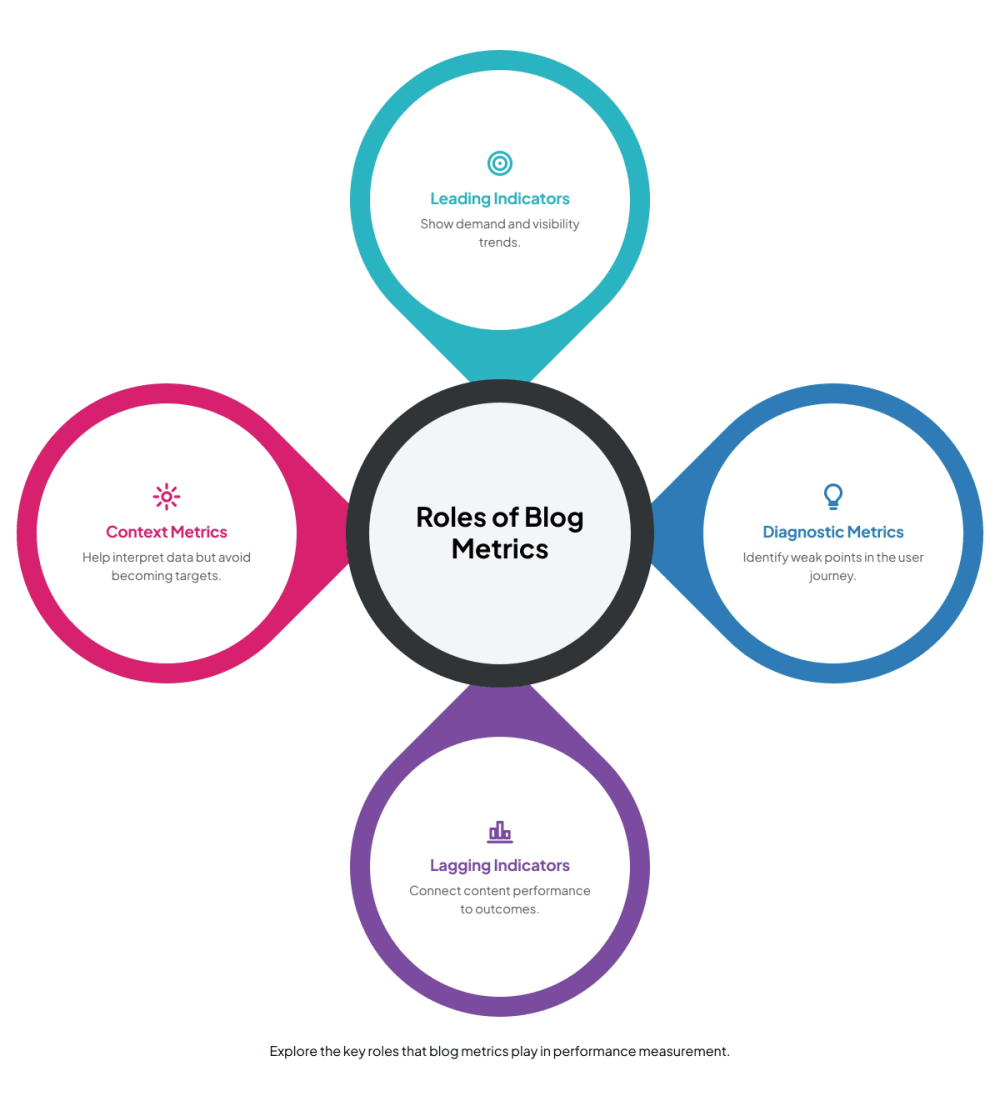
Leading indicators move before the final business result. Relevant impressions and query coverage show whether a page is earning discovery. Diagnostic metrics explain where a journey is breaking. Lagging indicators record completed outcomes such as qualified leads or opportunities. Context metrics help interpret the picture but should rarely become goals by themselves.
A useful scorecard mixes these roles. If you track only lagging outcomes, you may wait months to learn that a new topic is poorly aligned. If you track only leading indicators, the dashboard may celebrate visibility that never reaches a qualified reader.
1. Relevant search impressions. Count impressions only for queries that match the page’s intended topic and reader job. Compare completed periods and review the query mix. Rising relevant impressions suggest growing visibility. Rising impressions from unrelated searches signal topic drift, not success.
2. Nonbranded query coverage. Count distinct nonbranded queries that pass a minimum impression threshold. The threshold keeps one-off noise from inflating the total. Growth here can show that a page or cluster is earning broader topical relevance before clicks become meaningful.
3. Priority-query visibility rate. Formula: priority queries with impressions divided by all priority queries, multiplied by 100. Define the priority set before reporting. Use this metric to find missing subtopics and weak pages, not to force every phrase into one article.
4. Positions 8 to 30 opportunity share. Formula: relevant impressions from queries with average position 8 to 30 divided by all relevant impressions. A high share means the page is visible but has room to improve through better coverage, stronger internal links, clearer intent alignment, or a more useful answer.
Google Search Console defines clicks, impressions, CTR, and average position in the Performance report. Position is aggregated, so treat it as a directional signal and inspect the underlying query and page dimensions before changing content.
5. Organic click-through rate. Formula: organic clicks divided by impressions, multiplied by 100. Segment by query and page. If relevant impressions rise while CTR falls at a stable position, review the title, description, search intent, and result-page features before rewriting the body.
6. Organic landing sessions. Count sessions that begin on a blog page from organic search. This measures on-site arrivals rather than search-result clicks. Differences from Search Console are normal because the products use different measurement systems. Investigate trends, tracking changes, and landing-page mix.
7. Engaged sessions. Count sessions that last longer than 10 seconds, include a key event, or contain at least two page or screen views in GA4. Use the metric to compare similar pages and traffic sources. It does not prove that an article answered the reader’s question.
8. Engagement rate. Formula: engaged sessions divided by sessions, multiplied by 100. Compare pages with similar intent. A glossary entry and a long implementation guide can produce different healthy patterns. A decline after traffic growth may indicate a wider, less relevant query mix.
9. Average engagement time per session. This is the average time the site is in focus during a session. Use it with article length, scroll data, and intent. A short answer can succeed quickly, while a long guide may need more engaged time to deliver its promise.
10. Meaningful scroll completion. Formula: sessions reaching a chosen milestone divided by eligible sessions. Choose the milestone around a useful section or primary CTA, not an arbitrary percentage. A low rate can expose a weak introduction, poor mobile layout, or a mismatch between the title and opening.
11. Internal-link click rate. Formula: clicks on a relevant internal link divided by views of the section containing it. This shows whether the article helps readers continue to a supporting, pillar, or commercial page. Track placement so links below unread sections do not distort the result.
12. CTA view rate. Formula: sessions in which the primary CTA entered the viewport divided by eligible sessions. This separates a placement problem from a message problem. If few readers see the CTA, improve the path or placement before judging its copy.
13. CTA click-through rate. Formula: primary CTA clicks divided by CTA views, multiplied by 100. Evaluate one primary action per article. Segment by CTA placement and reader intent. A low rate often points to an offer that does not match the next job the reader wants to complete.
14. Form start rate. Formula: form starts divided by unique form views. This indicates whether the offer and first interaction are compelling enough to begin. A weak rate can result from unclear value, poor trust signals, premature placement, or fields that appear demanding.
15. Form completion rate. Formula: successful submissions divided by form starts, multiplied by 100. A large drop after the start points toward form friction, validation issues, confusing questions, privacy concerns, or a technical failure. Confirm the completion event before changing the offer.
16. Blog key-event rate. Formula: sessions with the selected blog key event divided by eligible blog sessions. Mark only actions that matter to the business, such as a qualified resource request, trial start, or demo request. Keep lower-value interactions available as diagnostic events.
17. Visitor-to-lead conversion rate. Formula: valid leads attributed to blog sessions divided by eligible blog visitors, multiplied by 100. Define a valid lead and remove spam, test records, and duplicate submissions. Report by landing page and offer so volume does not hide poor fit.
18. Qualified-lead rate. Formula: qualified leads divided by valid blog leads, multiplied by 100. Qualification may use role, company fit, problem, intent, or sales acceptance. This metric protects the team from optimizing for easy form fills that do not match the intended customer.
19. Opportunity creation rate. Formula: blog-sourced or blog-influenced opportunities divided by qualified blog leads. State the attribution rule and time window. For long buying journeys, review first-touch, last-touch, assisted, and self-reported evidence together instead of presenting one model as complete truth.
20. Content-influenced pipeline or revenue. Sum the value of opportunities or revenue that meet a documented content-influence rule. Keep sourced and influenced values separate. This metric can connect the blog to growth, but it inherits CRM quality, identity matching, sales-cycle length, and attribution limitations.

Get your free guide to understanding and implementing effective blog KPIs.
Vote for the blog metric you find most valuable!
What blog KPI do you prioritize?
Total pageviews, total keywords, social reactions, and sitewide average position can provide context. They become risky targets because teams can increase them without helping the intended reader or the business. Keep a context metric only when it helps explain a KPI movement.
For example, a pageview increase matters when the additional visitors arrive through relevant queries and move to a useful next step. A larger keyword count matters when those queries share the page’s intent. Average position matters when it is weighted by meaningful impressions and reviewed by query.
Start with one business outcome, one conversion outcome, two diagnostic measures, and two leading indicators. Record the owner, source, formula, comparison window, segment, and decision threshold for each. This is usually enough to guide action without turning the report into a warehouse of numbers.
Use completed periods, such as the latest 28 days versus the previous 28 days, plus a longer baseline when volume is low. Annotate publishing dates, major updates, campaigns, migrations, tracking changes, and outages. Separate new, established, and recently refreshed posts.
A practical article-level scorecard might include relevant impressions, positions 8 to 30 opportunity share, organic CTR, engagement rate, CTA click-through rate, and qualified-lead rate. A commercial comparison page may give more weight to product visits and trials. A broad educational guide may emphasize relevant discovery and assisted paths.
Start with relevant search impressions, organic CTR, engagement rate, CTA click-through rate, qualified-lead rate, and one business outcome. Adjust the mix to the article’s purpose and reader intent.
A compact article-level scorecard usually needs about six KPIs: two leading indicators, two diagnostic measures, one conversion outcome, and one business outcome.
A metric records an activity or result. A KPI is a metric tied to a specific objective, owner, comparison window, threshold, and decision.
Review mature content monthly using completed periods. Check tracking health more often, and give new or low-volume pages enough time to collect meaningful data.
Visitor-to-lead conversion rate measures how often eligible blog visitors become valid leads. Pair it with qualified-lead rate so high-volume, low-fit submissions do not look successful.
No. Pageviews show consumption, but they do not reveal query relevance, engagement quality, conversion, or business contribution. Use them as context alongside outcome-focused KPIs.
When impressions rise and clicks stay flat, inspect query relevance, position bands, and CTR. When organic sessions rise and engagement falls, check the landing-page query mix and opening promise. When engagement is healthy but CTA clicks are weak, review the next action. When form starts are healthy but completions fall, inspect friction and errors.
Change one meaningful variable at a time and record the date. Avoid declaring success from a short window with little volume. A metric is valuable when it narrows the next decision, not when it merely makes the dashboard look busy.
Measurement strategy still belongs to the team. You must define the page’s reader, intent, primary keyword, useful next step, and business outcome. A focused blog platform can reduce the implementation work around that plan.
Hyperblog brings publishing, technical SEO, structured content, internal-link suggestions, visual elements, lead magnets, and lead capture into one blog workflow. Those elements can support cleaner measurement paths, while analytics and CRM systems remain the sources for behavior, qualification, pipeline, and revenue data.
The best blog KPI set is small enough to review and specific enough to change a decision. Start with the article’s job, select the leading and diagnostic signals that explain progress, then connect them to one conversion and one business outcome. Keep the definitions stable, document attribution limits, and revise the scorecard when the content strategy changes.
Subscribe to Our Newsletter
Stay up to date with our latest news and updates.