
Distill
Bring the article's central framework into focus.
Give readers another way to understand your article. Generate an infographic from your content, review the result, and use it alongside the explanation.
14-day free trial No credit card required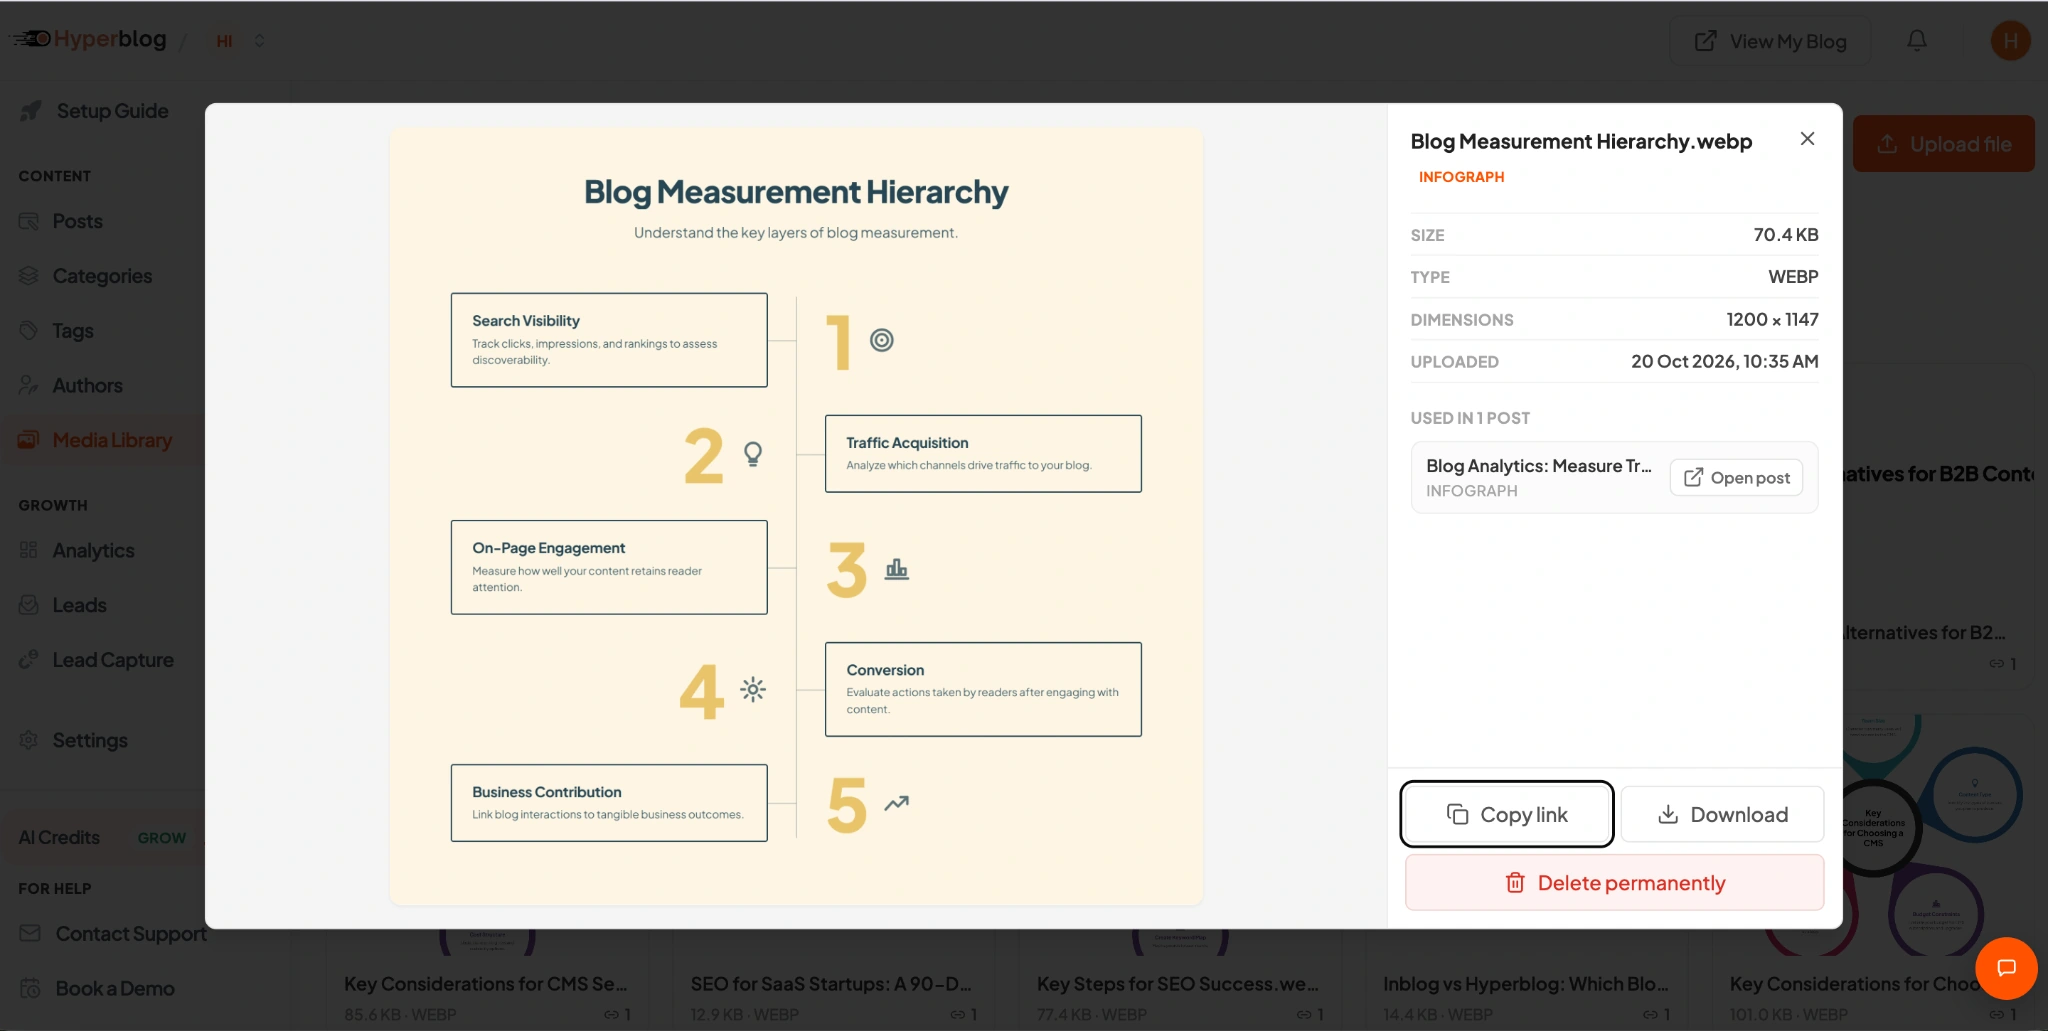
Bring the article's central framework into focus.
Give readers a visual path through the explanation.
Store the result with the content it came from.
Follow the blog measurement example from the finished infographic to its published context.
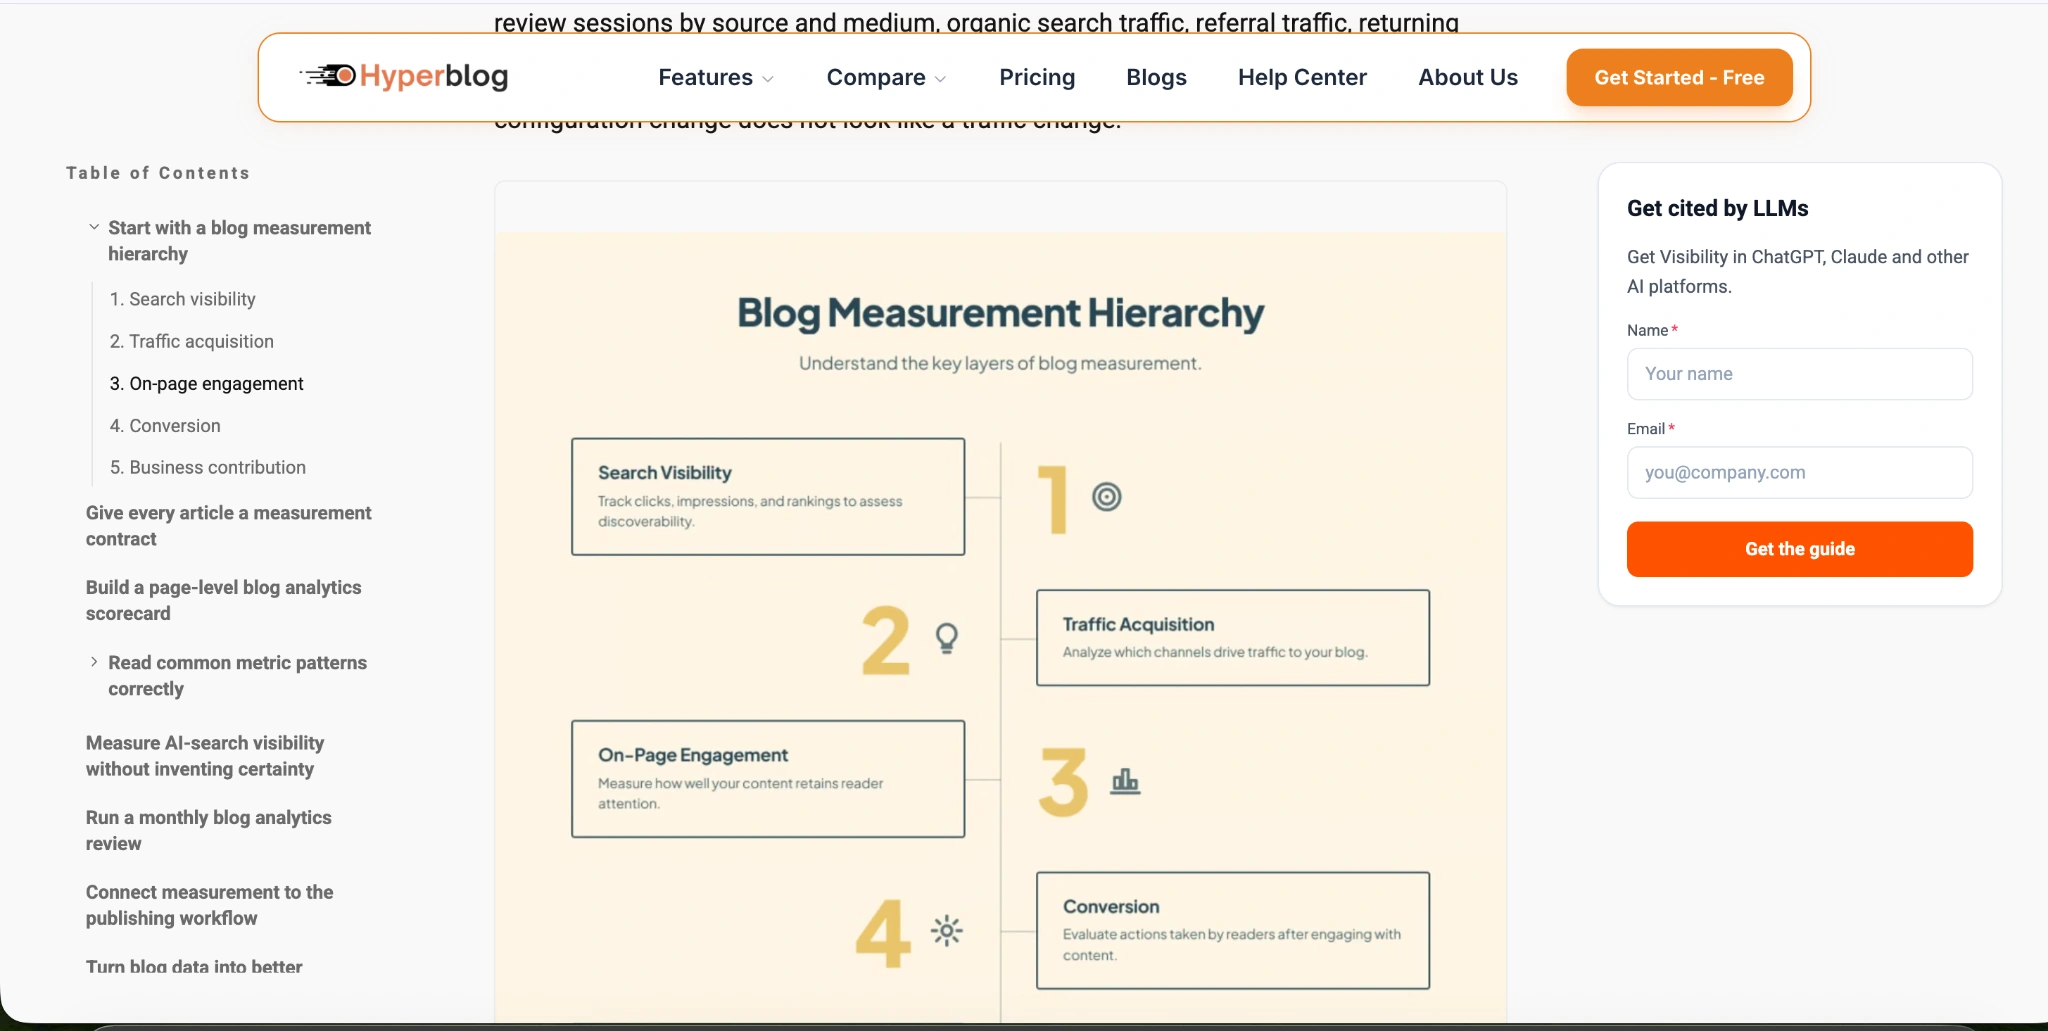
This graphic turns blog measurement into five layers, from search visibility to business contribution.
Readers can see the hierarchy alongside the article's detailed guidance. The visual supports the content instead of replacing it.
Preview the complete image, see the post it belongs to, and download it or copy its link from the Media Library.
A hierarchy or sequence becomes easier to follow when readers can see the relationship between its parts.
Give readers a useful change of pace inside a long article, with a graphic that adds information.
Generate from content you already have, then review the visual for accuracy and clarity.
Find infographics beside your other generated visuals, with previews and file details available.
Start with content that has a useful process, framework, or set of ideas.
Generate the visual and review its text, structure, and factual details.
Place the visual beside the explanation it supports and keep the asset in your library.
Processes, comparisons, frameworks, and step-by-step explanations give a visual a clear job. Choose an idea that becomes easier to understand when its parts are shown together.
No. It supports the written explanation. Keep the detail in the article and use the visual to help readers understand a specific idea or relationship.
Yes. The Media Library provides a preview, file details, a copy-link action, and a download action for generated visuals.
Yes. Review labels, spelling, facts, and any numbers before using the image. The strongest visual is both easy to understand and accurate.
Try turning a real article into an infographic during your 14-day free trial.
14-day free trial